NGOs release the first “Global Oil & Gas Exit List” at Glasgow COP
Nils Bartsch, Head of GOGEL Research, +49-176-66694994
Katrin Ganswindt, Senior Finance Campaigner, +49-176-32411130
Stefanie Jellestad, Communications Director, +49-152-37199229

Nils Bartsch, Head of GOGEL Research, +49-176-66694994
Katrin Ganswindt, Senior Finance Campaigner, +49-176-32411130
Stefanie Jellestad, Communications Director, +49-152-37199229
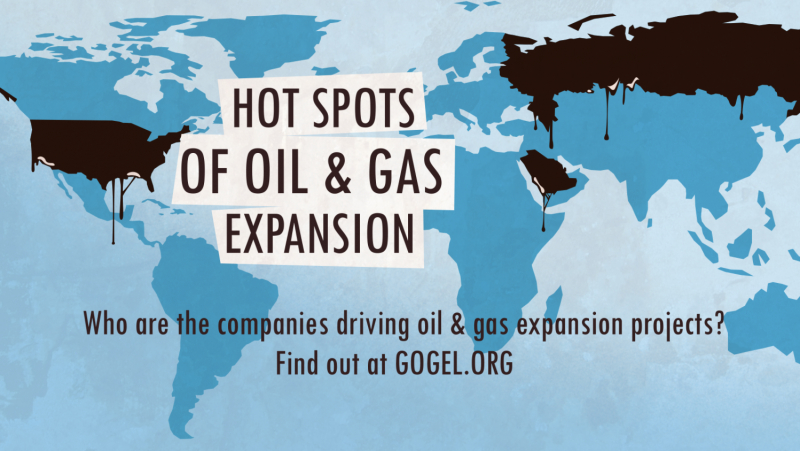
At the UN Climate Summit today, Urgewald and 20 NGO partners launched the “Global Oil & Gas Exit List” (GOGEL), an extensive public database that covers 966 oil and gas companies, which account for almost 95% of global oil and gas production. GOGEL provides detailed information that enables users to readily identify the largest oil and gas expansionists as well as the companies, which are responsible for the dirtiest and most controversial forms of oil and gas production.
“Over the past two years, we have seen a surge of coal exclusion policies by financial institutions, but almost none that address oil and gas,” says Katrin Ganswindt, Senior Finance Campaigner at Urgewald. “With the help of GOGEL, we want to motivate both public and private financial institutions to stop enabling the industry’s expansion and begin steering towards an oil and gas exit,” she adds.
Reckless Expansion Plans
According to UNEP’s 2020 Emissions Gap Report, greenhouse gas emissions from oil and gas are rapidly growing, with gas now the largest contributor to fossil CO2 emissions in some regions (1). “Our numbers show that the industry as a whole is on a reckless expansion course,” says Nils Bartsch, Head of GOGEL Research at Urgewald. Even if the use of coal was phased out overnight, emissions from developed oil and gas reserves would soon exhaust our carbon budget for 1.5°C (2). Yet over 80% of the upstream oil and gas producers listed on GOGEL are still preparing to develop new oil and gas reserves within the next few years.
“We should not be fooled by oil and gas companies’ pie in the sky promises for 2050. Adhering to our carbon budget requires an immediate end to oil and gas exploration and to the development of further oil and gas fields. The decisivedecade for action is now,” says Bartsch. “Behind each company that is developing new fossil fuel assets, there are banks, investors and insurers without whom these plans could not be realized,” says Ganswindt. GOGEL was designed to make companies’ fossil expansion activities visible, both to the finance world and the public.
Which Companies are Spending the Most on New Oil & Gas Exploration?
Upstream fossil fuel expansion begins with exploration. Over the past 3 years, oil and gas companies spent US$ 168 billion on exploration for new oil and gas resources. Over half of this amount was, however, spent by only 16 companies (see annex for a detailed list). All in all, GOGEL lists 387 companies, whose average capital expenditure on oil and gas exploration was higher than US$ 10 million annually. The five companies with the highest annual capital expenditures on oil and gas exploration (based on a 3-year average) are PetroChina (US$ 6 billion), China National Offshore Oil Corporation (US$ 2.8 billion), Shell (US$ 2.4 billion), Sinopec (US$ 2.3 billion) and Mexico’s Pemex (US$ 1.9 billion) (3).
“When even the International Energy Agency warns that all oil and gas exploration must cease, you know it is time to stop. Yet up to now, none of the big global banks involved in the ‘Glasgow Financial Alliance for Net Zero’ are willing to draw a red line for clients that are spending millions, or even billions of dollars on oil and gas exploration,” criticizes Ganswindt.
Which Upstream Oil & Gas Producers are the Biggest Expansionists?
Many oil and gas companies are notoriously untransparent, when it comes to reporting on their expansion plans. GOGEL therefore uses the Rystad Energy database to determine which new oil and gas assets companies are preparing to bring into production in the near future (4). According to this analysis, 506 upstream oil and gas producers are planning to add 190 billion barrels of oil equivalent (bboe) to their production portfolios within the next one to seven years (5). 14 companies are responsible for over half of this enormous expansion (see annex). The top five are: Qatar Energy (20 bboe), Gazprom (17 bboe), Saudi Aramco (15 bboe), ExxonMobil (7 bboe) and Brazil’s Petrobras (7 bboe).
New Oil & Gas Infrastructure Projects
Fossil fuel infrastructure such as pipelines, LNG terminals or gas-fired power plants are expensive to build and their intended operational lifetime spans decades. Gazprom’s 1,230 km long Nord Stream 2 pipeline, for example, cost € 9.5 billion, and has an expected lifetime of 50 years (6). Novatek’s and Total’s Arctic LNG 2 project will cost over US$ 21 billion and is being financed on the basis of 20-year long gas purchase agreements (7).
“New fossil fuel infrastructure projects pose a major danger to the Paris goals as they lock us into a high emissions pathway for decades to come. The 2021 GOGEL lists 274 midstream companies that are building new oil and gas pipelines or liquefied natural gas (LNG) terminals. Financiers need to exclude companies, whose fossil infrastructure plans are a sure-fire recipe for climate breakdown,” says Ganswindt.
Building Pipelines Halfway to the Moon
GOGEL lists all companies that are developing at least 100 kilometers of new oil or gas pipelines. This information is derived from Global Energy Monitor’s ‘Fossil Infrastructure Tracker’ and the compiled numbers for each company areprorated, to reflect their respective ownership percentages in new pipeline projects.
“The statistics are truly frightening,” says Bartsch. “There are currently 211,849 km of oil and gas pipelines under development. If they were laid end- to-end, they would reach halfway to the moon.” According to GOGEL, the top 5 oil and gas pipeline developers are: Gazprom (14.4 thousand km), PipeChina (13.4 thousand km), Sinopec (12.4 thousand km), China National Petroleum Corporation (9.3 thousand km) and India’s GAIL (8.5 thousand km). All in all, 29 companies are responsible for over 50% of pipelines under development (based on length).
Doubling the World’s LNG Terminal Capacity
The production of LNG is particularly energy intensive and methane leakages occur throughout the LNG lifecycle. To produce LNG, fossil gas is first cooled to -162 °C to liquefy it, then loaded onto LNG tankers and shipped to distant ports, where it must be re-gasified before it can be burned in a power plant. Almost half of the total greenhouse gas emissions from LNG thus occur before any electricity is generated.8 “Massive investments in LNG and new gas plants are blocking the transition to renewable energy all over Asia,” warns Gerry Arances from the Philippine Centre for Energy, Ecology and Development (CEED).
GOGEL features all companies that are developing LNG terminals with an aggregated annual capacity of at least 1 million tons per annum (Mtpa). As of 2021, new LNG terminals with a total capacity of 1,349 Mtpa are planned or under development (9). If brought online, these projects would double the world’s current LNG terminal capacity and lock in decades of new methane and CO2 emissions. The 5 top LNG terminal developers listed on GOGEL are: US- based Venture Global LNG (76 Mtpa), Qatar Petroleum (59 Mtpa), Kuwait Petroleum Corporation (33 Mtpa), Sinopec (29 Mtpa) and the China National Petroleum Corporation (27 Mtpa).
A Who is Who List of the Dirtiest Producers
Oil and gas production has become more and more extreme, as producers are drilling in fragile environments like the Arctic, using controversial extraction methods such as fracking or developing oil and gas assets that have an especially heavy environmental footprint such as tar sands or coalbed methane. According to GOGEL, these ‘unconventional’ sources account for 34% of current oil and gas production and 50% of the industry’s planned expansion projects. “It is unconscionable for the oil and gas industry to be increasing production at all – let alone in some of the most dirty and damaging types of oil and gas, long opposed by local communities. GOGEL reveals that production of unconventional fossil fuels is growing year on year,” says Alison Kirsch from Rainforest Action Network in the US.
GOGEL covers six categories of unconventional and especially controversial oil and gas production: Fracking, tar sands, extra heavy oil, coalbed methane, Arctic oil and gas and ultra deepwater drilling (1,500 meters or deeper below sea level). For each company, GOGEL displays which portion of its hydrocarbons production stems from these categories.
The largest producers in terms of absolute volumes for each category are:
-
Fracking: ExxonMobil, OccidentalPetroleum and EOG Resources
-
Tar sands: Canadian Natural Resources, Suncor Energy and Cenovus Energy
-
Extra heavy oil: Pemex, Ecopetrol and Chevron
-
Coalbed methane: Shell, Conoco Phillips and Origin Energy
-
Arctic: Gazprom, Novatek and Rosneft
-
Ultra deepwater: Petrobras, Shell and BP. (10)
When Will the Financial Sector Walk the Talk?
“Despite a flood of net zero alliances and climate ambition statements by CEOs, the vast majority of financial institutions still refuse to do the obvious: End their support for oil and gas expansion and exclude clients, who do not have plans to wind down their production in line with the 1.5 °C target,” says Lucie Pinson from the NGO Reclaim Finance.
A financial institution that has decided to walk the talk is La Banque Postale, the 11th largest bank in the Eurozone. In October 2021, La Banque Postale announced that it is suspending financial services to all companies involved in oil and gas expansion and will exit the entire industry by 2030. Skender Sahiti Manzoni from Banque Postale says: “We welcome the publication of Urgewald’s Global Oil and Gas Exit List. It will be a key resource for implementing our decision.”
About GOGEL
GOGEL was created to speed up the adoption of meaningful oil and gas policies by the financial sector. The database covers 94% of the upstream oil and gas sector, 91% of planned LNG terminal capacity and close to 75% of oil and gas pipelines under development. Next to the expansion and production metrics outlined in this briefing, GOGEL also highlights companies’ involvement in high reputational risk projects. These are projects that exacerbate violent conflicts, cause immense social or environmental harm or are challenged by lawsuits and community opposition. This part of the database is work in progress and will be updated on the GOGEL webpage throughout the year. GOGEL’s main sources ofinformation are Global Energy Monitor, Rystad Energy and company data sources such as annual reports, stock filings and investor presentations. The full GOGEL will be updated each fall and expanded over time to cover further sub-sectors of the oil and gas industry, such as gas-fired power and petrochemical expansion projects. As Tom Kruse from Rockefeller Brothers Fund says: “This is the database we have all been waiting for. It is public, it is meticulously researched and it is an essential tool to help us end the age of fossil fuels.”
GOGEL can be downloaded at www.gogel.org
Notes:
-
Chapter 2, UN Emissions Gap Report 2020
-
http://priceofoil.org/content/uploads/2020/09/OCI-Big-Oil-Reality-Check-vF.pdf
-
In order to balance out year-to-year variations, GOGEL provides a 3-year average of each company’s oil and gas exploration capex. The original data is sourced from Rystad Energy.
-
In its calculation of companies’ short-term expansion plans, GOGEL includes assets that are ‘under field evaluation’ (which means that a front-end engineering and design plan has been finalized) and assets that are ‘under development’ (which means infrastructure and wells are being developed). These are the two life cycle stages of an oil and gas asset that directly precede the production stage.
-
The exact timeframe depends on the type of asset. Offshore assets generally have longer development periods than, for example, fracking assets.
-
https://www.nord-stream2.com/media/documents/pdf/en/2019/07/factsheet-rock-placement-en-201806.pdf
-
https://www.nrdc.org/sites/default/files/sailing-nowhere-liquefied-natural-gas-report.pdf
-
These numbers are based on Global Energy Monitor’s Fossil Infrastructure Tracker and include both LNG export and import terminal capacity.
-
Urgewald analysis on the basis of data from Rystad Energy.


